I know that not everyone loves graphs and data. Personally, I often find data dizzying and glaze over, so if charts and percents aren’t your thing, here are some good viola jokes instead. But if you do like charts, buckle-up because I made a lot of them… The goal here was to illustrate trends and tendencies in the production of violas over the past five-hundred years. There aren’t many surprises: we all know there are fewer violas than violins and cellos, that violas come in different shapes and sizes, that some makers specialized in violas, and others wouldn’t touch them with a ten foot chisel. I hope that seeing these graphs can give a new dimension to the much loved instrument that burns longer than the violin.
Violas as a percentage of total instruments ever made
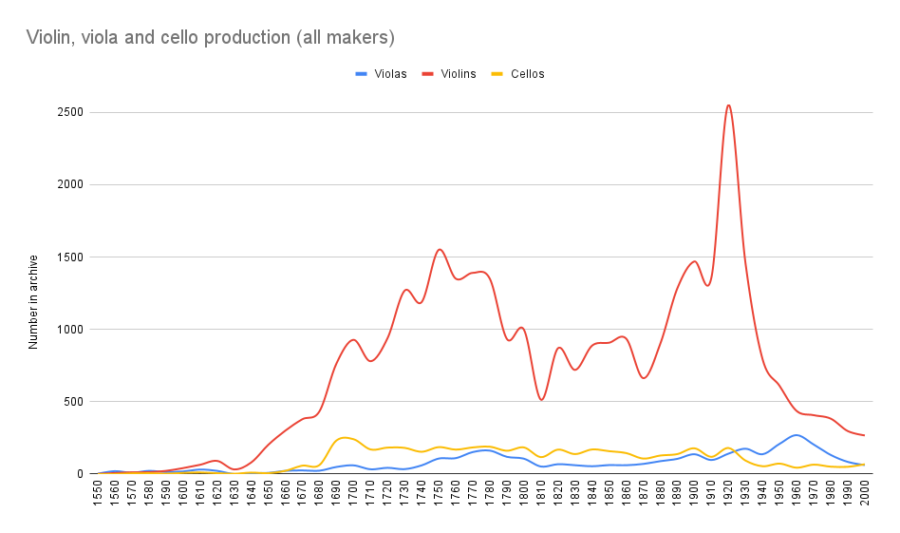
This first graph shows the total number of instruments built per decade worldwide since the beginning of violin-time: the red line is violins, blue is violas and yellow, cellos. A few observations:
-
- Instrument making all across Europe grew rapidly in the late 17th and early 18th centuries.
- The number of violins made in 1750 was nearly ten times the number made a century earlier.
- Viola and cello production also increased during this period but not as rapidly as violins.
- The dip at around 1630 represents the plague years.
- The decline over the last fifty years of the chart represents a data flaw – instruments made during this time have not fully arrived on the secondary market.
- Global violin production peaked from 1880-1930 with centers of mass production (Mirecourt, Markneukirchen) added to traditional artisanal workshops.
- Although violin production increased greatly over the past three hundred years, viola and cello production stayed relatively constant.
- There are two periods of noticeable growth for viola making: the end of the 18th century and the middle of the 20th.
Although violin production increased greatly over the past three hundred years, viola and cello production stayed relatively constant.
(The data in this article come from the Cozio archive. The information in the archive is extensive and rich and, for the most part, very accurate. Nevertheless there are a few biases and flaws that I have taken into consideration including: the attrition of instruments over time, historic mis-attributions and cluster dating around circa dates.)
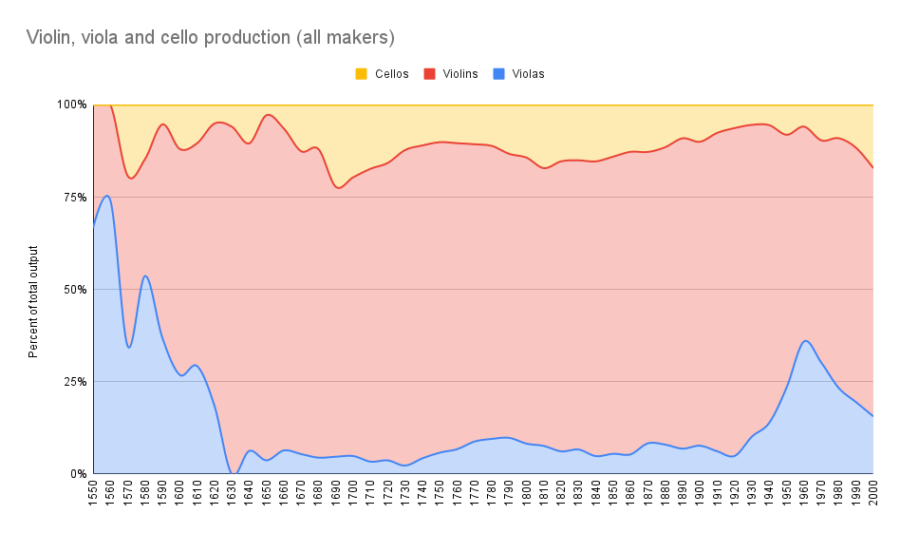
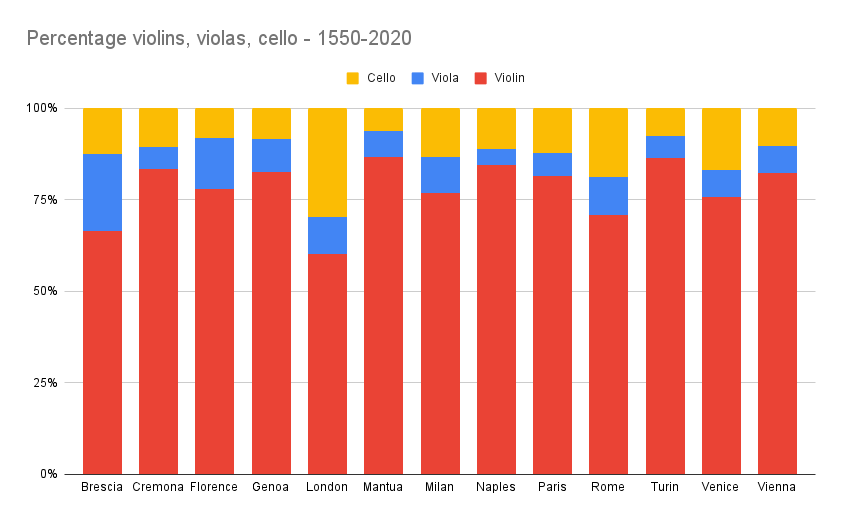
Here again is a graph of the total global output of instruments, but this time violins, violas and cellos are represented as a percentage of the total yearly global output.
-
- What’s fascinating here is to see that violas were produced in much higher percentages in the 16th and early 17th centuries relative to violins.
- Before 1630 the ratio of violins to violas was approximately 3:1.
- After the plague, viola production declined precipitously and the ratio became closer to 25:1.
- Anecdotally we know this to be true: the Amati family and the early Brescian luthiers made a higher concentration of violas than later makers did.
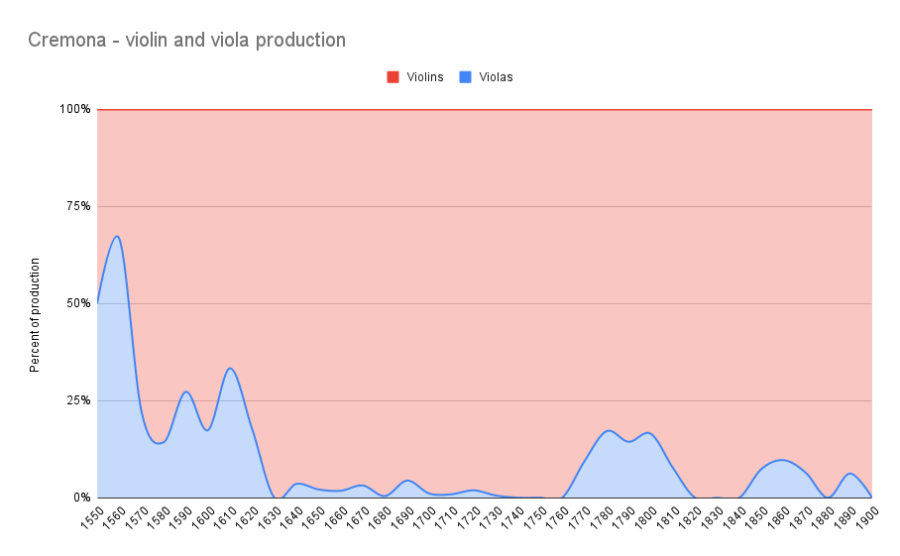
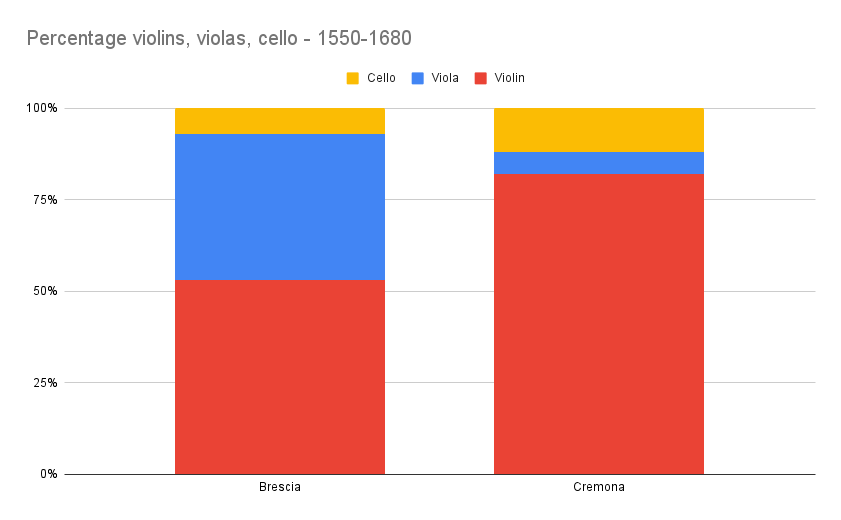
Here is another graph showing the stacked percentages of total production, but this time I have included only violins and violas made in Cremona.
-
- Between 1650 and 1700, violas represented only 2-3% of instruments made in Cremona (cellos are excluded from this graph).
- Nicolo Amati continued to make a few excellent violas but Stradivari’s violas account for 1% of his production; the Guarneri family was similar; and violas by Carlo Bergonzi and the Rugeri are almost non-existent.
- By 1740 there were virtually no violas being made in Cremona.
- And then around 1770 we see an increase in viola production when makers like Storioni and Nicola Bergonzi began making violas once again.
![]()
Regional production of violas compared to violins
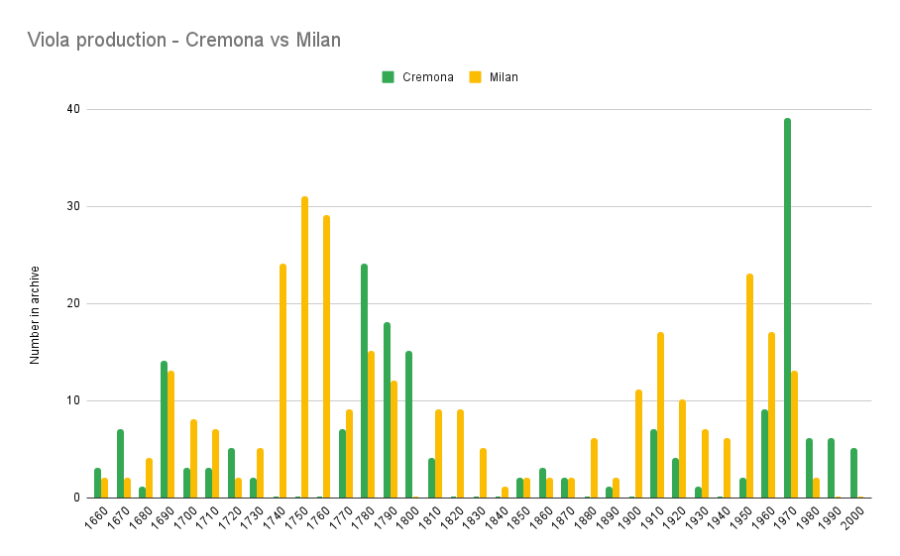
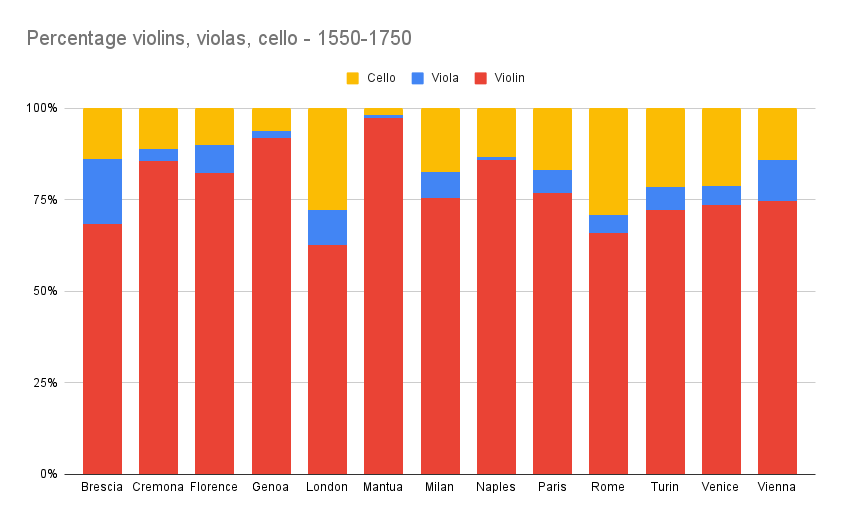
These five graphs show the production of violas and violins in five principle violin making cities of Italy: Cremona, Brescia, Milan, Venice and Naples. The scale and time frame changes slightly to accentuate the trends of each city. Some things I notice:
-
- Each city shows booms and busts. Generally speaking, the first part of the 18th century was a boom and somewhere towards the middle of that century came a bust.
- Naples seems to have kept the boomtime running longest; it wasn’t until the late 18th century that Naples began to decline.
- Brescia blooms only briefly when the Rogeris came to town.
- Milan, Venice and Naples show a clear resurgence of the ‘Modern Italian’ school starting in the late 19th century and continuing until the 1920s or 30s.
- Viola production is fairly flat in all of these graphs. We’ll have a look at the details to see why.
![]()
